
This Labour Market Bulletin provides an analysis of Labour Force Survey results for the province of Ontario, including the regions of Hamilton-Niagara Peninsula, Kingston-Pembroke, Kitchener-Waterloo-Barrie, London, Muskoka-Kawarthas, Northeast, Northwest, Ottawa, Stratford-Bruce Peninsula, Toronto and Windsor-Sarnia.
SUMMARY
- Employment increased by 42,700 (+0.6%) jobs in October 2022, with the majority of gains in part-time employment (+37,400; +2.8%).
- The unemployment rate rose for the fourth consecutive month to 5.9% in October, 0.1 percentage point up from the previous month.
- Employment in both the goods- and services-producing sectors experienced gains, with the majority concentrated in the latter.
LABOUR FORCE CHARACTERISTICS
Employment in Ontario grew in October 2022 from the previous month, representing a 2.0% year-over-year increase.
- Overall employment gains in October (+42,700; +0.6%) were mostly attributed to part-time work (+37,400; +2.8%).
- However, employment losses were observed in women working full-time (-18,200; -0.7%), as well as the core working age population (aged 25 to 54) in full-time employment (-8,600; -0.2%), and older workers (aged 55 and over) in part-time employment (-10,500; -2.9%).
- Across Canada, employment rose by 108,300 (+0.6%) jobs from the previous month, with all provinces experiencing gains. Ontario and Quebec accounted for the most nominal job gains (+42,700; +27,800), while Prince Edward Island and Newfoundland and Labrador saw the greatest growth (+5.3%; +1.1%).
| Seasonally Adjusted Monthly Data |
October 2022 | September 2022 | October 2021 | Monthly Variation | Yearly Variation | ||
|---|---|---|---|---|---|---|---|
| Number | % | Number | % | ||||
| Population 15 + ('000) | 12,569.7 | 12,549.6 | 12,383.7 | 20.1 | 0.2 | 186.0 | 1.5 |
| Labour Force ('000) | 8,157.6 | 8,102.6 | 8,115.2 | 55.0 | 0.7 | 42.4 | 0.5 |
| Employment ('000) | 7,679.0 | 7,636.3 | 7,529.3 | 42.7 | 0.6 | 149.7 | 2.0 |
| Full-Time ('000) | 6,314.9 | 6,309.6 | 6,155.2 | 5.3 | 0.1 | 159.7 | 2.6 |
| Part-Time ('000) | 1,364.1 | 1,326.7 | 1,374.1 | 37.4 | 2.8 | -10.0 | -0.7 |
| Unemployment ('000) | 478.6 | 466.3 | 585.9 | 12.3 | 2.6 | -107.3 | -18.3 |
| Unemployment Rate (%) | 5.9 | 5.8 | 7.2 | 0.1 | - | -1.3 | - |
| Participation Rate (%) | 64.9 | 64.6 | 65.5 | 0.3 | - | -0.6 | - |
| Employment Rate (%) | 61.1 | 60.8 | 60.8 | 0.3 | - | 0.3 | - |
* Totals may not add due to rounding
Source: Statistics Canada Labour Force Survey – Table 14-10-0287, formerly CANSIM 282-0087
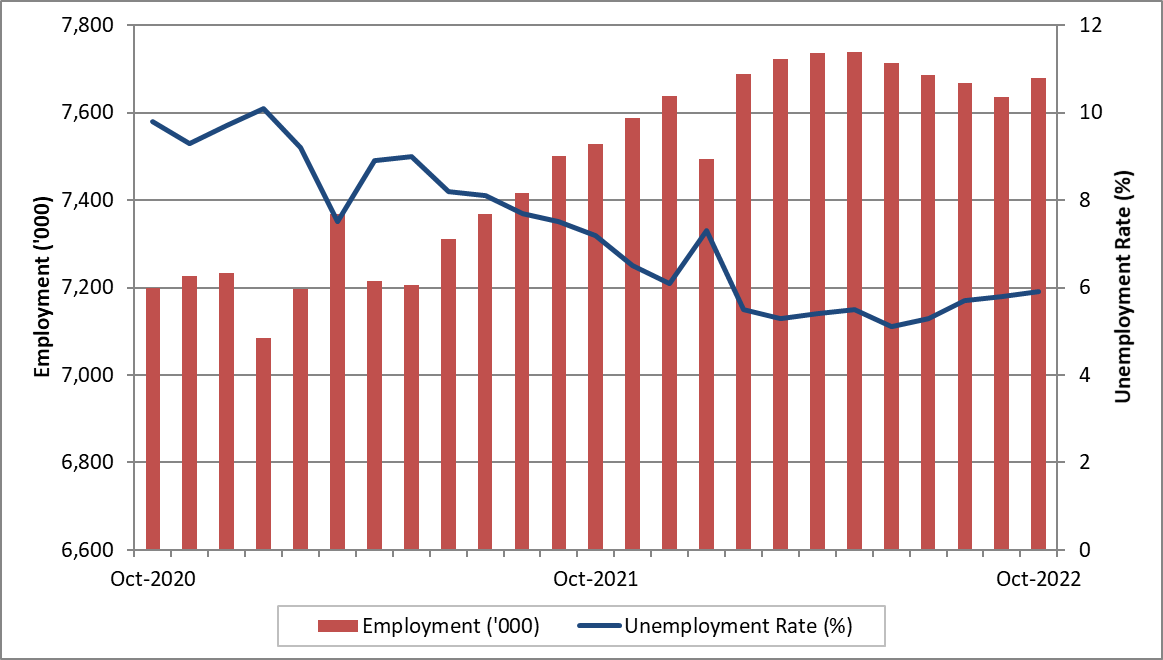
Show data table:Ontario Monthly Employment and Unemployment Rate
| Unemployment Rate (%) | Employment ('000) | |
|---|---|---|
| Oct-2020 | 9.8 | 7,199.2 |
| Nov-2020 | 9.3 | 7,687.0 |
| Dec-2020 | 9.7 | 7,232.9 |
| Jan-2021 | 10.1 | 7,085.1 |
| Feb-2021 | 9.2 | 7,197.5 |
| Mar-2021 | 7.5 | 7,368.3 |
| Apr-2021 | 8.9 | 7,214.6 |
| May-2021 | 9.0 | 7,206.1 |
| Jun-2021 | 8.2 | 7,311.2 |
| Jul-2021 | 8.1 | 7,367.7 |
| Aug-2021 | 7.7 | 7,416.2 |
| Sep-2021 | 7.5 | 7,499.7 |
| Oct-2021 | 7.2 | 7,529.3 |
| Nov-2021 | 6.5 | 7,586.7 |
| Dec-2021 | 6.1 | 7,639.2 |
| Jan-2022 | 7.3 | 7,493.5 |
| Feb-2022 | 5.5 | 7,687.8 |
| Mar-2022 | 5.3 | 7,722.9 |
| Apr-2022 | 5.4 | 7,737.2 |
| May-2022 | 5.5 | 7,739.1 |
| Jun-2022 | 5.1 | 7,714.4 |
| Jul-2022 | 5.3 | 7,687.0 |
| Aug-2022 | 5.7 | 7,667.8 |
| Sep-2022 | 5.8 | 7,636.3 |
| Oct-2022 | 5.9 | 7,679.0 |
| Seasonally Adjusted Data | October 2022 (%) |
September 2022 (%) |
October 2021 (%) |
Monthly Variation (% points) |
Yearly Variation (% points) |
|---|---|---|---|---|---|
| Total | 5.9 | 5.8 | 7.2 | 0.1 | -1.3 |
| 25 years and over | 4.7 | 4.8 | 6.7 | -0.1 | -2.0 |
| Men - 25 years and over | 4.4 | 4.6 | 6.5 | -0.2 | -2.1 |
| Women - 25 years and over | 5.0 | 5.1 | 6.9 | -0.1 | -1.9 |
| 15 to 24 years | 12.9 | 11.5 | 10.4 | 1.4 | 2.5 |
| Men - 15 to 24 years | 12.1 | 12.1 | 11.5 | 0.0 | 0.6 |
| Women - 15 to 24 years | 13.8 | 10.9 | 9.2 | 2.9 | 4.6 |
* Totals may not add due to rounding
Source: Statistics Canada Labour Force Survey – Table 14-10-0287, formerly CANSIM 282-0087
EMPLOYMENT BY INDUSTRY
Employment increased in Ontario’s goods-producing sector by 5,100 (+0.3%) jobs in October 2022. The largest gains were made in manufacturing (+4,600; +0.6%) and agriculture (+2,200; +3.1%), while the construction sector experienced 3,800 job losses (-0.7%).
Manufacturing
- Employment in the sector grew by 4,600 (+0.6%) jobs in October from the previous month.
- The Markit Canada Manufacturing Purchasing Managers' Index (PMI), which provides an indication of the overall health of the industry, registered at 48.8 in October 2022, a decrease from 49.8 in the previous month. [1]
- Recent currency weakness led Canadian firms to raise their selling prices in order to protect their profits, though such higher prices led to weakening demand, which contributed to further declines in new orders and subdued international demand for Canadian goods. Production levels and output also contracted at an accelerated pace, and manufacturers continued to indicate a further shortage of skilled labour. [2]
- Delivery delays were the least pronounced since February 2020, prior to the onset of the COVID-19 pandemic, indicating some signs of easing supply chain pressures. Manufacturers remained cautiously optimistic about their output levels in the year ahead, with growing concerns over a recession and the implications of higher interest rates. [3]
Construction
- Sector employment decreased for the third consecutive month, declining by 3,800 (-0.7%) jobs in October from the previous month.
- The Bank of Canada issued a sixth consecutive interest hike on October 26, further cooling the province's housing market. [4]
- The Ontario government announced plans to build 1.5M homes in the next decade, [5] as well as a $3.7M investment to train up to 2,500 workers to address labour shortages in the industry. [6]
- Meanwhile, the value of building permits issued in Ontario fell 32.0% in September from the previous month, or a year-over-year decline of 7.6%. [7]
Employment in Ontario’s services-producing sector increased by 37,600 (+0.6%) in October 2022, with accommodation and food services (+12,900; +3.3%) and professional, scientific and technical services (+11,700; +1.5%) accounting for the highest gains. Notable job losses were observed in the wholesale and retail trade (-12,200; -1.1%) and information, culture and recreation industries (-8,400; -2.6%).
Professional, scientific and technical services
- Employment in the professional, scientific and technical services sector rose by 11,700 (+1.5%) jobs in October, amidst recent workforce challenges in the tech industry with layoffs and hiring freezes.
- Most recently, the Ottawa region observed notable boosts in funding and expansion announcements for tech firms such as Nokia, [8] Global IQX, [9] and Versaterm. [10]
Wholesale and retail trade
- Wholesale and retail trade employment contracted by 12,200 (-1.1%) jobs in October.
- Retailers are preparing for the upcoming holiday season, and have already begun recruitment of temporary workers. However, employers face challenges in filling seasonal roles due to a reduction in the pool of part-time labourers, which has grown from last year but remains below pre-pandemic levels. [11]
| Seasonally Adjusted | October 2022 | September 2022 | October 2021 | Monthly Variation | Yearly Variation | ||
|---|---|---|---|---|---|---|---|
| Number | % | Number | % | ||||
| Total employed, all industries | 7,679.0 | 7,636.3 | 7,529.3 | 42.7 | 0.6 | 149.7 | 2.0 |
| Goods-producing sector | 1,524.7 | 1,519.6 | 1,467.1 | 5.1 | 0.3 | 57.6 | 3.9 |
| Agriculture | 72.9 | 70.7 | 67.2 | 2.2 | 3.1 | 5.7 | 8.5 |
| Forestry, fishing, mining, quarrying, oil and gas | 43.3 | 42.4 | 37 | 0.9 | 2.1 | 6.3 | 17.0 |
| Utilities | 64.6 | 63.5 | 57.7 | 1.1 | 1.7 | 6.9 | 12.0 |
| Construction | 575.4 | 579.2 | 533.1 | -3.8 | -0.7 | 42.3 | 7.9 |
| Manufacturing | 768.5 | 763.9 | 772.1 | 4.6 | 0.6 | -3.6 | -0.5 |
| Services-producing sector | 6,154.3 | 6,116.7 | 6,062.2 | 37.6 | 0.6 | 92.1 | 1.5 |
| Trade | 1091.3 | 1103.5 | 1118.9 | -12.2 | -1.1 | -27.6 | -2.5 |
| Transportation and warehousing | 381.3 | 377.4 | 378.5 | 3.9 | 1.0 | 2.8 | 0.7 |
| Finance, insurance, real estate and leasing | 666.4 | 670.0 | 627.3 | -3.6 | -0.5 | 39.1 | 6.2 |
| Professional, scientific and technical services | 794.9 | 783.2 | 753.2 | 11.7 | 1.5 | 41.7 | 5.5 |
| Business, building and other support services | 307.7 | 303.0 | 291.2 | 4.7 | 1.6 | 16.5 | 5.7 |
| Educational services | 572.5 | 563.4 | 556.3 | 9.1 | 1.6 | 16.2 | 2.9 |
| Health care and social assistance | 925.5 | 921.4 | 912.0 | 4.1 | 0.4 | 13.5 | 1.5 |
| Information, culture and recreation | 309.2 | 317.6 | 335.2 | -8.4 | -2.6 | -26.0 | -7.8 |
| Accommodation and food services | 398.6 | 385.7 | 402.6 | 12.9 | 3.3 | -4.0 | -1.0 |
| Other services | 264.2 | 256.1 | 273.8 | 8.1 | 3.2 | -9.6 | -3.5 |
| Public administration | 442.7 | 435.4 | 413.3 | 7.3 | 1.7 | 29.4 | 7.1 |
* Totals may not add due to rounding
Source: Statistics Canada Labour Force Survey – Table 14-10-0355, formerly CANSIM 282-0088
REGIONAL ANALYSIS
In October 2022, all but one economic region in Ontario, Northwest, reported a year-over-year increase in employment compared to October 2021. Compared to pre-pandemic employment levels in October 2020, all 11 economic regions had higher levels of employment in October 2022.
The unemployment rate in all economic regions declined compared to last year (October 2021), as well as prior to the onset of the pandemic in October 2020.
Notable changes between October 2021 and October 2022 include:
- Employment increased by 19.2% (+31,200) in the Muskoka-Kawarthas economic region, as full-time employment increased by 24.6% (+30,800) and part-time employment increased by 0.8% (+300).
- The labour force in the Muskoka-Kawarthas economic region grew by 14.6% (+25,500). This is reflected in the participation rate increase from 50.5% to 56.6%.
- Employment in the Toronto economic region increased by 0.3% (+10,700), as full-time employment increased by 1.2% (+37,800) and part-time employment decreased by 4.4% (-27,200).
| 3-Month Moving Averages Seasonally Unadjusted Data |
Employment | Unemployment Rate | ||||
|---|---|---|---|---|---|---|
| October 2022 ('000) |
October 2021 ('000) |
Yearly Variation (%) |
October 2022 (%) |
October 2021 (%) |
Yearly Variation (% points) |
|
| Ontario | 7,688.1 | 7,514.2 | 2.3 | 5.6 | 7.4 | -1.8 |
| Economic Regions | ||||||
| Ottawa | 770.2 | 725.8 | 6.1 | 4.2 | 5.8 | -1.6 |
| Kingston - Pembroke | 229.5 | 223.3 | 2.8 | 4.7 | 5.7 | -1.0 |
| Muskoka - Kawarthas | 193.3 | 162.1 | 19.2 | 3.5 | 7.4 | -3.9 |
| Toronto | 3,674.9 | 3,634.2 | 0.3 | 6.3 | 8.4 | -2.1 |
| Kitchener - Waterloo - Barrie | 821.6 | 780.9 | 5.2 | 5.7 | 6.1 | -0.4 |
| Hamilton - Niagara Peninsula | 784.3 | 767.4 | 2.2 | 5.2 | 6.7 | -1.5 |
| London | 384.7 | 375.3 | 2.5 | 5.8 | 7.2 | -1.4 |
| Windsor - Sarnia | 312.8 | 307.4 | 1.8 | 6.6 | 8.2 | -1.6 |
| Stratford - Bruce Peninsula | 165.9 | 162.2 | 2.3 | 2.3 | 3.0 | -0.7 |
| Northeast | 251.0 | 245.6 | 2.2 | 4.5 | 6.2 | -1.7 |
| Northwest | 99.9 | 99.9 | 0.0 | 4.5 | 5.8 | -1.3 |
* Totals may not add due to rounding
Source: Statistics Canada Labour Force Survey – Table 14-10-0387, formerly CANSIM 282-0122
Note
In preparing this document, the authors have taken care to provide clients with labour market information that is timely and accurate at the time of publication. Since labour market conditions are dynamic, some of the information presented here may have changed since this document was published. Users are encouraged to also refer to other sources for additional information on the local economy and labour market. Information contained in this document does not necessarily reflect official policies of Employment and Social Development Canada.
For further information, please contact the LMI team.For information on the Labour Force Survey, please visit the Statistics Canada website.
- Date modified: