
Economic Scan - Newfoundland and Labrador: 2023
Demographics

Highlights
- The proportion of seniors aged 65+ is projected to increase from 23.6% in 2022 to 29.3% in 2032.
- In 2022, individuals aged 55 and over accounted for 45.6% of the working-age population. This is projected to reach 48.7% in 2032.
- The proportion of youth (15-29) is projected to decline from 16.3% in 2022 to 15.4% in 2032.
- Most youth work in environments that prevent teleworking, led by retail trade as well as accommodation and food services.
The Indigenous population represents 9.3% of the total provincial population (2021 Census) and faces more challenging labour market conditions. This includes a higher unemployment rate and lower participation rate when compared to the non-Indigenous population.
Recent immigrants (those arriving between 2016 and 2021) accounted for 29.9% of Newfoundland and Labrador’s immigrant population in 2021. The pace of new arrivals has increased significantly in recent years, particularly as the province has placed considerable emphasis on increasing immigration levels to fill labour market gaps. Immigrants have a higher participation rate and a lower unemployment rate when compared to people born in Canada.
99.4% of Newfoundlanders and Labradorians identified English as their first official language (2021 Census), while 0.5% identified the province's other official language, French. Only 0.1% identified a first language that was neither English nor French.
In 2017, 23.6% of the provincial population aged 15 and over were persons with disabilities. The 2017 Canadian Survey on Disability revealed that participation in the labour market for those aged 25 to 64 years was much lower for persons with disabilities when compared to the rest of the population (54.1% versus 80.6%). The unemployment rate for those aged 25-64 years with disabilities (14.6%) was slightly higher than the rate for persons without disabilities (13.4%).
Labour Market Conditions
In 2022...
Employment rebounded sharply (+4.4%)
Unemployment declined significantly (-11.6%)
Participation rate rose moderately (57.6% to 58.4%)
Employment rate recovered (50.0% to 51.9%)
Province's Unemployment Rate
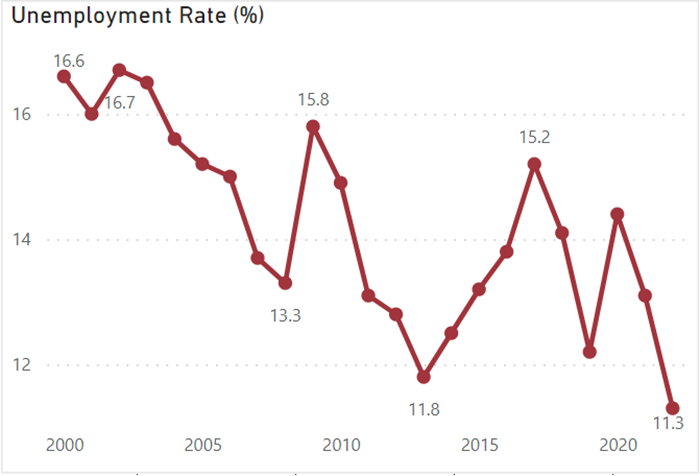
Show data table: Provincial Monthly Employment and Unemployment Rate
| Year | Unemployment Rate (%) |
|---|---|
| 2000 | 16.6 |
| 2001 | 16.0 |
| 2002 | 16.7 |
| 2003 | 16.5 |
| 2004 | 15.6 |
| 2005 | 15.2 |
| 2006 | 15.0 |
| 2007 | 13.7 |
| 2008 | 13.3 |
| 2009 | 15.8 |
| 2010 | 14.9 |
| 2011 | 13.1 |
| 2012 | 12.8 |
| 2013 | 11.8 |
| 2014 | 12.5 |
| 2015 | 13.2 |
| 2016 | 13.8 |
| 2017 | 15.2 |
| 2018 | 14.1 |
| 2019 | 12.2 |
| 2020 | 14.4 |
| 2021 | 13.1 |
| 2022 | 11.3 |
- The recovery from the effects of the COVID-19 pandemic continued in 2022, adding 9,700 jobs over the previous year. This growth was mainly in full-time positions. The unemployment rate fell to 11.3%, the lowest on record going back to 1976.
- The lifting of public health restrictions early in the year was the main factor behind the job growth. Nearly 80% of the increase was in the services-producing sector. Employment in most age groups has surpassed pre-pandemic levels of 2019.
Economic Conditions
Province 's Economic Drivers in 2022
Population growth
Higher construction investment
Retail sales up
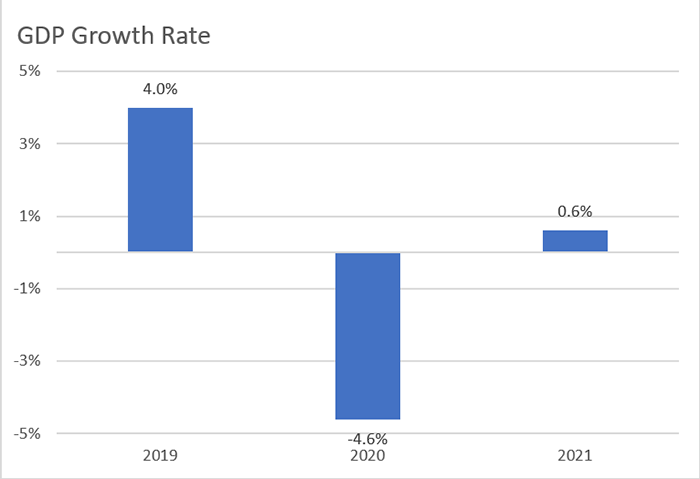
Show data table: Provincial Monthly Employment and Unemployment Rate
| Year | GDP growth rate |
|---|---|
| 2019 | 4.0% |
| 2020 | -4.6% |
| 2021 | 0.6% |
- The province’s population increased by 1.1% to 526,000 in 2022. Between July 1, 2021 and July 1, 2022, net international in-migration reached a record high (+4,884). In addition, net interprovincial migration also reached a new high (+2,930). These changes outweighed losses resulting from deaths exceeding births.
- Construction investment climbed 11.5% over 2021 levels. Increased investment in oil and gas projects and continued work on the Voisey’s Bay Mine Expansion project were key factors behind the growth. Housing starts in 2022 were 35% higher than in the previous year
- Retail sales increased by 7.5% in 2022. This was mainly due to pent-up demand following the COVID-19 pandemic. Sales at food services and drinking establishments rose by 13.2% for the year.
Risks to the province Economy in 2023
- Global economic conditions are expected to be weaker than average, due to persistent high inflation and the conflict in Ukraine. Weakness in key markets such as the U.S. and U.K. may soften demand for key exports such as seafood, and iron ore. In addition, there is a significant amount of crab in storage from last year’s fishery. This could result in weak markets for a key species in the province.
- Interest rates are expected to remain high throughout 2023, which will translate into higher mortgage payments for homeowners and other forms of debt. This will continue to limit spending on goods and services, particularly for those of a non-essential nature. Higher rates can also have a negative impact on business investment, which may restrain employment growth.
Regional Issues
- Newfoundland and Labrador has the oldest population in the country, and is aging faster than any other province. Furthermore, outmigration among younger groups has been a long-term issue, particularly in rural areas. International immigration levels have increased and need to remain elevated to help address labour shortages.
- The issue of climate change has become a key concern for this province in terms of how it can transition from an oil-dependent economy into one that capitalizes on green opportunities. Considerable emphasis will be required to allow for a just transition among its workforce to be able to work in new, green jobs and industries.
- While the provincial government produced a surplus in 2022-23 due to higher than forecast oil royalties and higher tax revenues, fiscal challenges remain. As a share of GDP, the province's net debt remains the highest in the country. Debt financing consumes a large share of provincial expenses. Also, health spending has grown and will remain a challenge to contain with an aging population. This creates notable challenges in meeting the demand for other essential needs.
Industry Trends
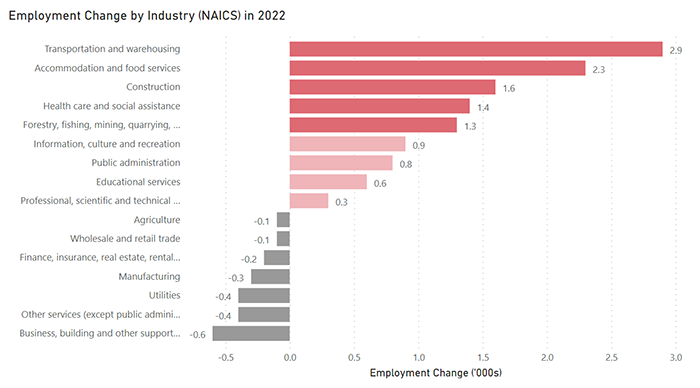
Show data table
| Industry (NAICS) | Employment Change ('000s) |
|---|---|
| Transportation and warehousing | 2.9 |
| Accommodation and food services | 2.3 |
| Construction | 1.6 |
| Health care and social assistance | 1.4 |
| Forestry, fishing, mining, quarrying, oil and gas | 1.3 |
| Information, culture and recreation | 0.9 |
| Public administration | 0.8 |
| Educational services | 0.6 |
| Professional, scientific and technical services | 0.3 |
| Agriculture | -0.1 |
| Wholesale and retail trade | -0.1 |
| Finance, insurance, real estate, rental and leasing | -0.2 |
| Manufacturing | -0.3 |
| Utilities | -0.4 |
| Other services (except public administration) | -0.4 |
| Business, building and other support services | -0.6 |
- Following a steep decline to its lowest employment level on record, transportation and warehousing rebounded strongly in 2022. However, employment in the industry remained lower than the pre-pandemic level of 2019, mainly due to air transportation.
- Accommodation and food services also grew considerably following two years of job losses. The lifting of COVID-19 public health restrictions played a considerable role in this growth.
- Health care and social assistance reached a record employment high for the second consecutive year in 2022. An aging population has been a key contributor to increased health care demands.
- While overall employment increased in 2022, wholesale and retail trade was relatively unchanged. Despite the addition of jobs in the provincial economy, higher inflation combined with a lack of labour availability restrained growth in the industry.
Regional Economic Conditions
- Virtually all of the province’s employment gain in 2022 was on the Avalon Peninsula. Employment growth was mainly in the service-producing sector, led by the accommodation and food services industry.
- Employment was unchanged in the South Coast-Burin Peninsula and Notre Dame-Central-Bonavista Bay region. Following a sharp loss in transportation and warehousing in 2021, employment in this industry rebounded to exceed pre-pandemic levels.
- In the West Coast-Northern Peninsula-Labrador region, gains in the goods-producing sector were offset by losses in service-producing industries. Since experiencing large losses in 2020, construction and manufacturing have surpassed pre-pandemic levels.
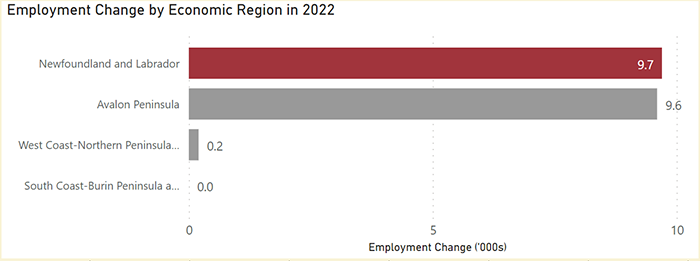
Show data table
| Region | Employment Change ('000s) |
|---|---|
| Newfoundland and Labrador | 9.7 |
| Avalon Peninsula | 9.6 |
| South Coast-Burin Peninsula-Notre Dame-Central Bonavista Bay | 0.2 |
| West Coast-Northern Peninsula-Labrador | 0.0 |
- Date modified: